- About
 News/In the Media
Siteman Cancer Center ranked No. 10 among U.S. cancer centers
Siteman Cancer Center at Barnes-Jewish Hospital and Washington University School of Medicine has been named No. 10 among cancer centers nationally by U.S. News & World Report. The recognition is part of the overall ranking…
Read The Full Story - TreatmentClinical
How Siteman is leading the way in personalized brain tumor treatment
If you or a loved one have recently been diagnosed with a brain tumor, you likely feel a great deal of fear and have many questions. The brain is the epicenter of who we are,…
Read The Full Story - VisitingNews/In the Media
Siteman Cancer Center expands proton therapy treatment
Siteman Cancer Center at Barnes-Jewish Hospital and Washington University School of Medicine is expanding proton therapy for patients by adding the latest, most innovative technology to its S. Lee Kling Proton Therapy Center with the addition of…
Read The Full Story - PreventionPrevention
Siteman explains what every woman should know about endometrial cancer risk, symptoms and screening
Endometrial cancer is the fourth most common cancer for women in the United States. It also accounts for approximately 4 percent of cancer deaths in women. However, because it is usually diagnosed early, it is…
Read The Full Story - ResearchResearch
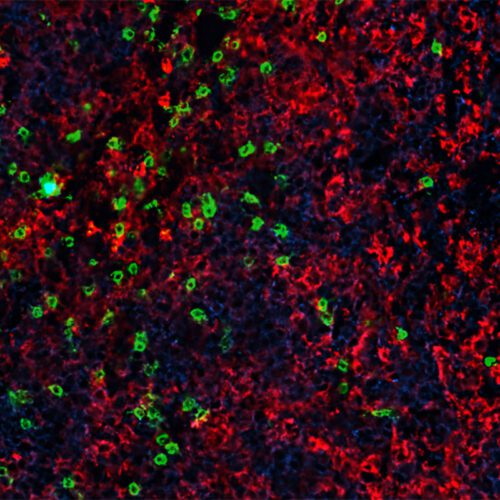
Immunity boosting treatment enhances CAR-T cell therapy for blood cancers
Advances in cellular immunotherapy that spur genetically modified T cells to attack cancer cells have revolutionized the treatment of certain blood cancers. Six such CAR-T cell therapies are approved by the Food and Drug Administration…
Read The Full Story - CliniciansNews/In the Media
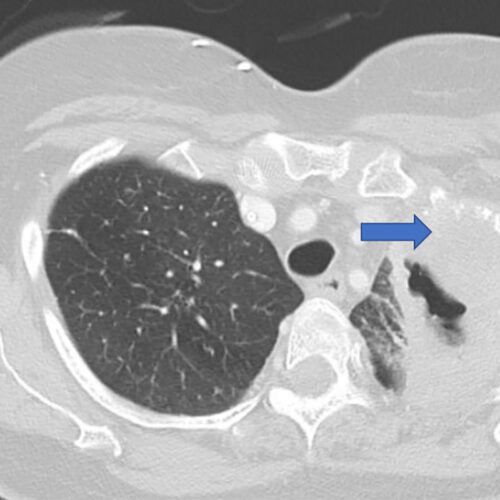
$5.3 million grant supports research into lung cancer recurrence
Researchers at Washington University School of Medicine in St. Louis are leading a national study aimed at identifying patients with early-stage lung cancer who are at high risk of having the cancer return, even after…
Read The Full Story - GiveNews/In the Media
Couple honors physician with gift for distinguished professorship
Endowment will support leader in gynecologic oncology Financial adviser Elizabeth Mannen Berges lives each day with heightened gratitude for the basic components of a meaningful life—fulfilling work, caring relationships, and a sense of purpose. A…
Read The Full Story